|
|
Laboratory
for ChemoMetrics,
Vienna (Austria) MS - Chemometrics - COSIMA |
|

|
Summary of Results: Chemometrics with PDMS Data Exploratory Data Analysis |
|
|
The first step in
multivariate data analysis is often a principal component analysis (PCA). PCA can be considered as a projection of the multidimensional
features space onto a plane. The position of the plane is computed with the aim
to optimally represent the data structure (the distances between the objects).
Typical result of PCA is a scatter plot containing a point for each spectrum. By
a visual inspection of the plot clusters may be detected.
Main purpose of applying PCA
to the PDMS data was to search for clusters with compounds exhibiting common
structural properties.
Example: PCA plot for the 53 negative
ion PDMS spectra each characterized by 100 spectral features (possessing the
highest variances).
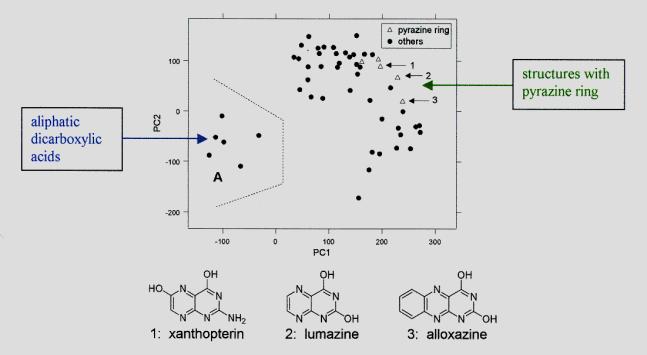
First (PC1) and second
principal component (PC2) preserve 17.9 and 12.0 % of the total variance,
respectively. That means, only a rather small part of the distance information
in the 100-dimensional space is contained in the plot.
Nevertheless, clusters can be easily detected that
contain compounds with similar chemical structures:
Cluster "A" contains 6 of the 8 aliphatic dicarboxylic
acids present in
the data set. The 2 other compounds of this substance class are outside the
cluster (a hydroxy-dicarboxylic acid, and an amino-dicarboxylic acid).
Another group of points
(marked by triangles) represents all compounds containing a pyrazine ring.
This result
indicates that chemical structure information is contained in the PDMS data
(and in the derived spectral features). This structure information can be
extracted by multivariate data analysis.
Other
subjects
|
|
|
|
[ Aims | People | Results | Presentations | Pictures | ROSETTA | COSIMA Instrument
| Comet
Wirtanen | Literature
] |
Last update 2000-12-03 |